During times of crisis, market leaders often revise their strategies, focusing on how to protect the existing revenue base and identifying new paths to growth. Integral to the work is analyzing business trends, selecting key metrics to track, and determining a proper cadence for reporting KPIs.
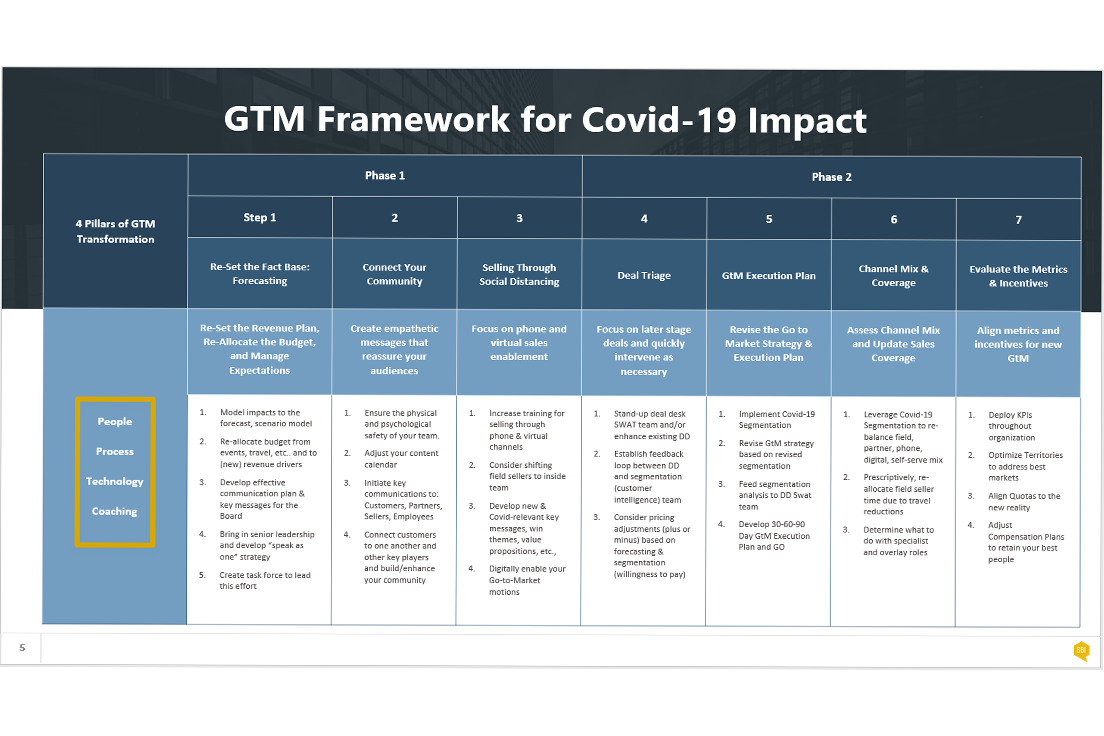
SBI's COVID-19 Readiness Framework outlines a seven-step approach for sustaining growth during various crisis scenarios. This framework, though originally conceived during the COVID-19 pandemic, is applicable to different types of crises. It describes strategies to protect revenue through forecasting, budget allocation, and virtual selling. Additionally, there is a revenue growth revision strategy, which includes mobilizing resources for late-stage deals, revising the GTM strategy, and assessing channel mix and coverage. The final step is to align metrics and deploy the relevant KPIs throughout the organization.
The pandemic may have caused a shift in the KPIs that businesses are being measured against. It's crucial to realign these indicators post-revision of your revenue growth strategy, ensuring that key metrics are monitored to maintain focus and execution in challenging times.
If you are unsure where to begin, SBI identifies a list of 10 essential metrics, categorized into behavioral, leading, and lagging indicators, to guide businesses in this process.
Behavioral Indicators – Tracking the Day-to-Day of a Virtual Selling Model
Behavioral indicators track key activities to maintain client relationships and drive new business. In a virtual model, this takes the form of monitoring seller productivity in order to allocate resources dynamically.
- Selling time: In evolving market conditions, such as those experienced during the COVID-19 pandemic, selling time serves as a key behavioral indicator. The shift to virtual selling, necessitated by the pandemic, resulted in a notable reduction in travel time to and from clients for many organizations. This change prompts leaders to strategize on effectively reallocating the newfound time for optimal productivity.
Leading Indicators – Setting Yourself up To Be Ready for the Future
Leading indicators help predict the health of an organization, the health of its pipeline, and the forecasting revenue. In a crisis, leading indicators will help you progress stalled pipelines and replenish lost opportunities.
- Percentage of revenue (or bookings) allocated to sales and marketing: You may need to reallocate your budget. This metric is essential for conveying new budget figures to your board and contextualizing them to assess overall return on investment.
- Pipeline coverage ratio: In light of potential stalls or losses in parts of your pipeline, the pipeline coverage ratio becomes a vital metric. It measures sales opportunities against the set quota. Revisiting and adjusting quota assignments is necessary, and this metric will be instrumental in guiding that revision.
- Seller turnover: Turnover is the percentage of sales professionals that leave your organization over a given period of time, either voluntarily or involuntarily. In uncertain times, it is critical to retain top talent and create an environment that allows them to be successful.
Lagging Indicators – Gain Insight From the Past To Know Where To Make Adjustments
Lagging indicators will help you identify which opportunities are slowing down, increases in churn, and changes in close rates. They reveal the efficiency and effectiveness of your team during a crisis, offering valuable insights for post-crisis analysis and strategy refinement.
- Bookings attributed to marketing: This KPI effective assesses marketing's effectiveness in generating or influencing opportunities. Its quantified as the percentage of total bookings originating from marketing efforts.
- Annual bookings per seller (or per FTE): This metric calculates the total new business bookings generated by each sales professional. It varies based on factors like sales cycle duration, average deal size, and product/service complexity. You will need to monitor this metric across segments and geographies.
- Dollar retention rate: In times of crisis, retention becomes as critical as growth. You must protect your existing customer base by prioritizing accounts and getting the right people in the most effective roles. The retention rate measures how much revenue has been retained over a specific period.
- Revenue mix: Focus on three primary revenue sources: renewals or upsells from the existing base, expansion (cross-sell) within the existing base, and acquisition of new customers.
- Quota attainment by seller: You will likely need to align quotas to the new reality. The quota attainment KPI accounts for how well your targets are set at the individual and territory levels. You want to look at overall attainment as well as the percentage of sellers that are hitting their quota, with an emphasis on the strategies top performers are employing.
- Win rate: This is an important metric to track in crisis times because it identifies slowdowns in opportunities and lagging close rates. It's calculated as the ratio of won deals to total closed opportunities within a given period. Segmenting this metric by product, region, segment, or stage offers deeper insights into the health and dynamics of your pipeline and business.
How are you approaching the problem of realigning your KPIs to your altered strategy? Are all of these KPIs relevant to you, and how can you think about scaling this up or down? SBI has several tools that will help you plan and implement these KPIs into your organization. The KPI Process Planner Tool will allow you to identify a customized process for tracking key metrics and benchmarks, assign ownership to specific people and teams for maintenance, and highlight gaps in your current knowledge base that need to be filled. Additionally, the KPI dashboard tool helps to visualize key metrics. It provides the insight that allows your organization to work off of a single source of truth.

